
Introduction
Convolutional neural networks are often known as “black boxes” for their mysterious nature. Unlike most programs that we write, computer scientist can’t directly modify the content (weights) of the neural networks to improve their performance. In order to create better machine learning models, you can either do a heck more training or experiments with the model architecture.
The interesting properties of ConvNets make visualization difficult. There are many different ways to visualize the behaviors of ConvNets; there are also many ways to visualize data in high dimensional space. After reading some posts and open-source projects, I realized that attention maps are probably the best way to visualize my steering network.
When the neural network is performing a task, such as predicting the steering angle of a vehicle, I want to know what the CNN is “thinking”. What features is it extracting? Which part of the image is it focusing on? Attention maps (or activation maps) can provide that information.
Methods for Visualization
Conv Filter Visualization
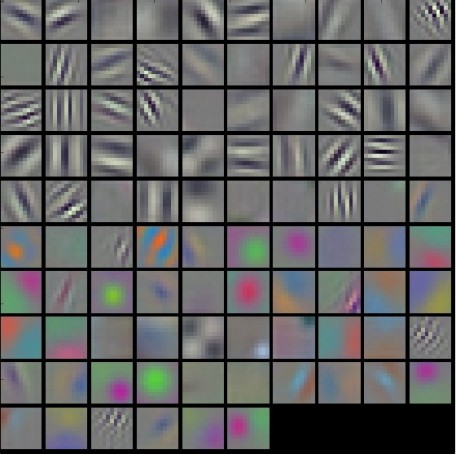
Conv/FC Filters is a common strategy to visualize the weights. The visualization results are usually most interpretable on the first Conv layer which is looking directly at the raw pixel data. When looking at weights deeper in the network, the Conv Filter visualization can give us a lot of information about how well the network is training. According to the famous Stanford CS231 computer vision course, “The weights are helpful to visualize because well-trained networks usually display nice and smooth filters without any noisy patterns. Noisy patterns can be an indicator of a network that hasn’t been trained for long enough, or possibly a very low regularization strength that may have led to overfitting.”
Activation maps
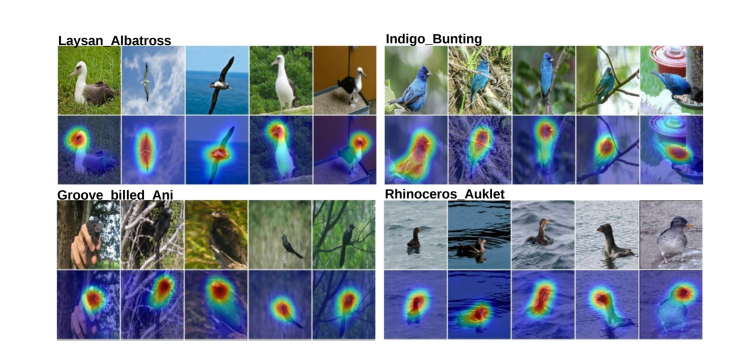
Class activation maps are a simple technique to get the discriminative image regions used by the CNN to predict the appropriate steering angle associated with the image. In other words, an activation map lets us see which regions in the image were relevant to this prediction. An MIT research group focused on this problem of “Deep Learning Features for Discriminative Localization”. Unlike visualizing steering predictions (which is regression problem), the team focused on visualizing classification problems. They showed that class activation maps also allows re-using classifiers for getting good localization results, even when training without bounding box coordinates data. This also shows how deep learning networks already have some kind of a built-in attention mechanism.
If you are drawn to this specific topic, there is a really good blog post about it. Or, you can check out the paper what I was referring to.
Visualizing the Network
I implemented a quick visualization class with a terrific library called keras-vis. According to the project, keras-vis “is a high-level toolkit for visualizing and debugging your trained keras neural net models.” The updated code for the steering module can be found here.
Image 1

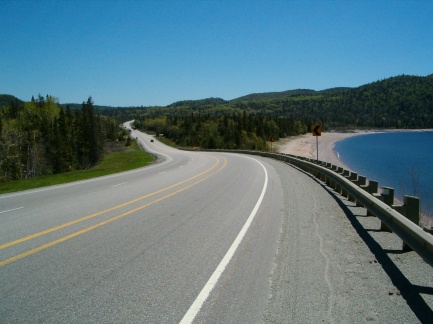
I expected the model to pay more attention to the lane lines. However, it focused on the curb of the highway. Perhaps more surprisingly, the model focused on the sky as well.
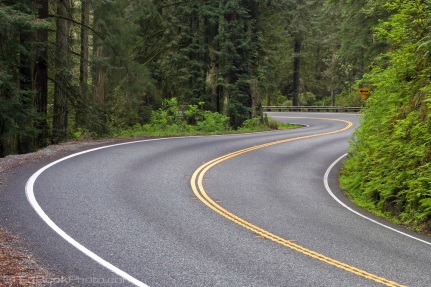
Image 2
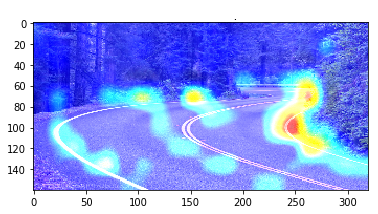
I think this image shows promising results. Clearly, the model focused on the right side of the road. Also, the model paid attention to the directions of the lane lines.
Conclusion
The visualization in this post is by no mean a complete understanding of the neural network. I still need to dive much deeper into the behavior of my trained ConvNet. With these visualizations in mind, I can try to modify my program to explore the behavior of the models. I have also implemented this visualization on the golf cart’s computer, so as the vehicle is running in real time, I can see what the model is paying attention to.
Thank you for reading. If you have any questions, comments or concerns, please contact me at contact@neilnie.com.
Further Reading
If you are interested in these kinds of contents related to machine learning, you might like these posts as well:

10 replies on “Visualizing the Steering Model with Attention Maps”